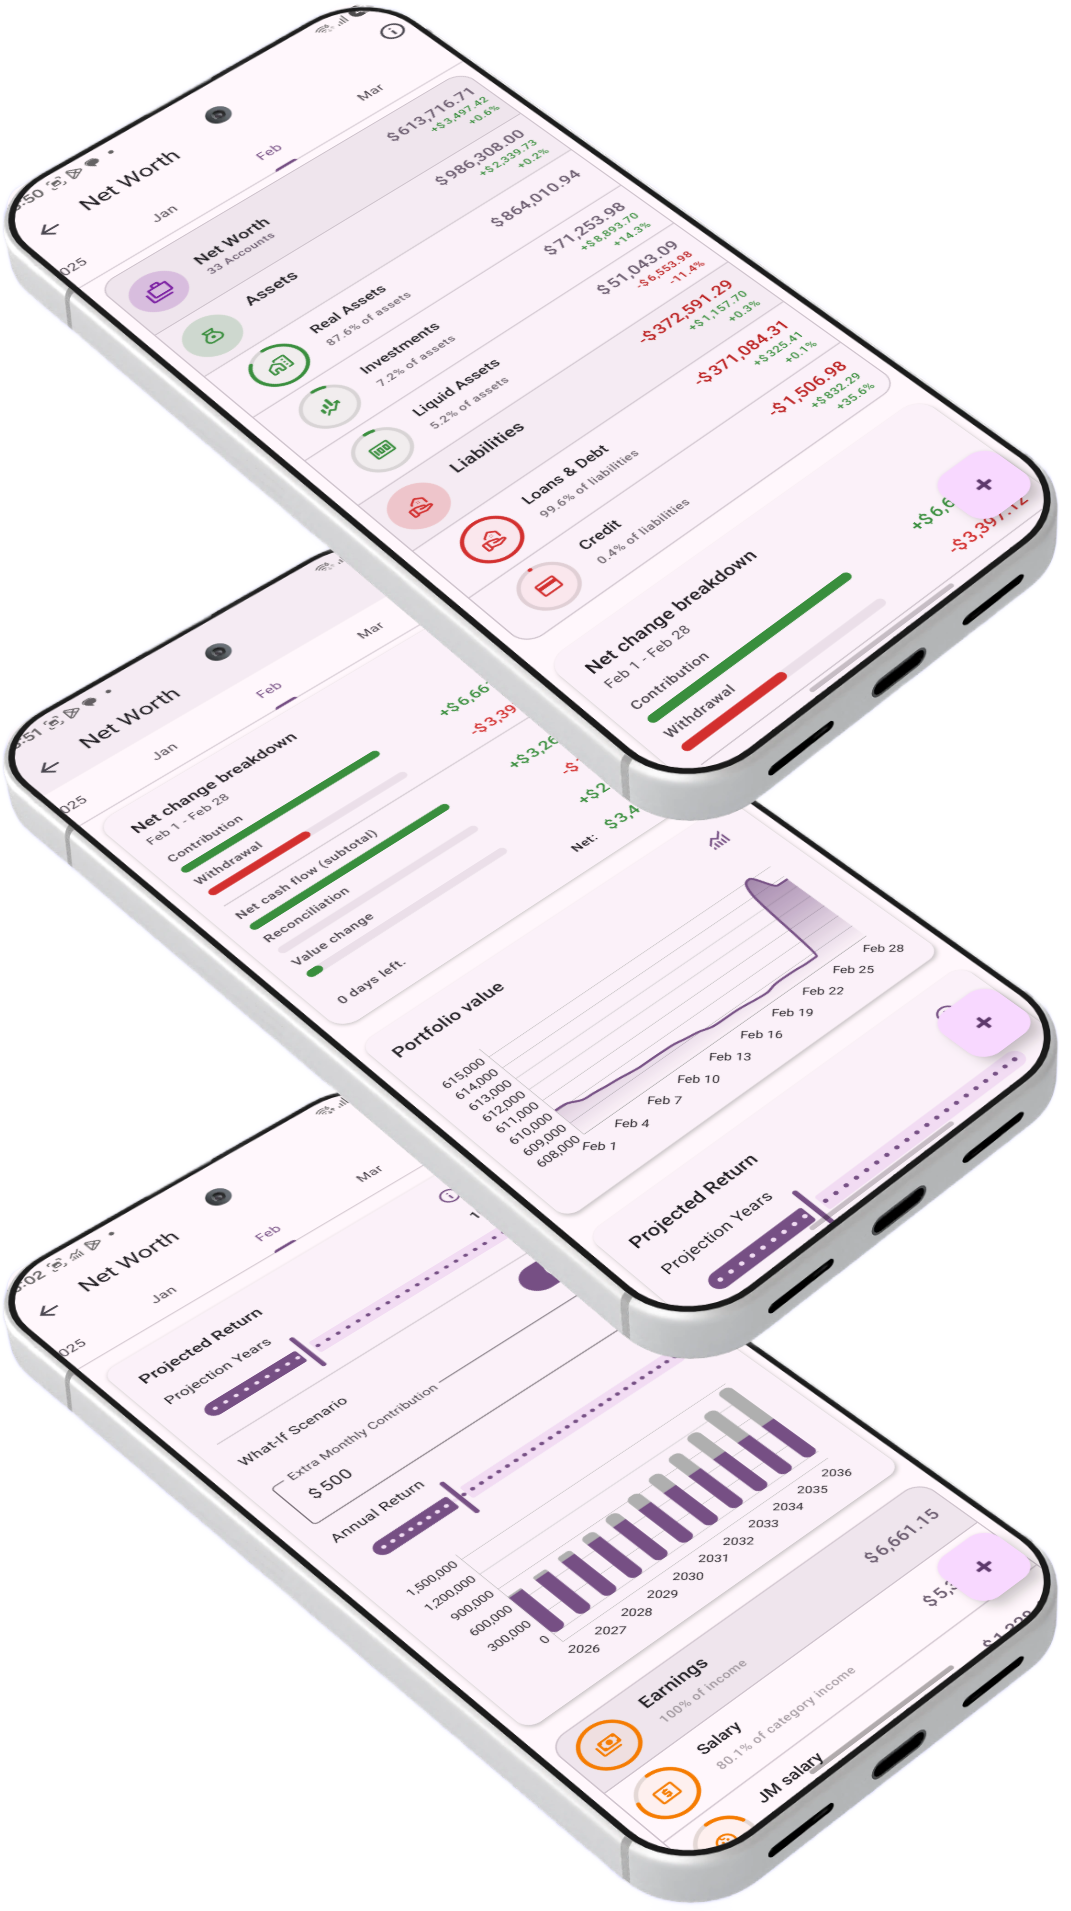
Portfolios give you a clear picture of where you stand financially — see how your assets and liabilities evolve over time, monitor debt reduction, and track investment growth across any combination of accounts.
A portfolio is a way to group one or more of your accounts together and view them as a single financial picture. While budgets track spending against targets, portfolios focus on what you own and what you owe — your balance sheet.
Each portfolio shows a combined balance across its accounts, broken down into assets and liabilities. BudgetViz automatically categorises each account based on its type and shows you how your wealth is distributed — and how it's changing over time.
Day-to-day budgeting tells you where your money goes. Portfolios answer a different question: where do you stand? They shift the focus from cash flow to wealth — letting you see the bigger picture of your financial health and track meaningful progress over months and years.
A portfolio brings all your accounts together into a single balance sheet. Instead of checking accounts one by one, you see your total assets, total liabilities, and net worth in one view — with growth tracking over each period.
Every portfolio tracks period-over-period changes — both as absolute amounts and percentages — at every level of the hierarchy. Watch your investments grow, your debt shrink, or your liquid reserves build up over time.
Create multiple portfolios to monitor different aspects of your finances — an investment portfolio, a debt tracker, a liquid assets view — each with its own reporting period and currency. Focus mode lets you drill even deeper.
By grouping different sets of accounts, you can monitor different aspects of your financial health. Here are some common approaches:
Include all accounts for a complete overview of your assets vs. liabilities and how your overall wealth is changing.
Group just your everyday and savings accounts to monitor your available funds and cash flow health.
Track growth across all your investment, retirement, and crypto accounts in a single performance view.
Group your loans and credit cards to track your total debt balance and watch it decrease over time.
Set a balance target to track a savings goal. Any portfolio can have an optional balance target. Set one, and a progress bar appears on the portfolio card showing how close you are to your goal — whether that's reaching $10,000 in your emergency fund, paying off all your debt, or hitting a net worth milestone.
You can create a new portfolio from the portfolio list screen by tapping the + button. BudgetViz walks you through a simple setup where you configure the following options.
Give it a descriptive name like "Net Worth", "Investment Portfolio", or "Household Finances". A name is the only required field.
Pick a Material icon and a colour to help you quickly identify the portfolio in lists and on your dashboard.
Choose which accounts to include. You can select any combination of accounts — or leave this empty to create a net worth portfolio that includes all accounts automatically.
If your accounts use different currencies, choose a reporting currency. BudgetViz will convert all balances into this currency for a unified view. Leave this blank to use your default currency.
Choose the time window for your portfolio analysis — monthly, quarterly, yearly, or any custom recurring period. This determines the period over which balance changes and growth are measured in your charts and reports.
Working toward a savings goal? Enter a target balance and a progress bar will appear on the portfolio card — both on the dashboard and in the detail view — showing how close you are. Leave it empty if you just want to track balances without a specific goal in mind.
When you create a portfolio without selecting any specific accounts, it automatically represents all of your accounts. This is the simplest way to track your complete net worth in a single view.
In net worth mode, every account you have in BudgetViz is included in the balance sheet — current accounts, savings, investments, property, loans, credit cards, and more. If you add a new account later, it will automatically appear in this portfolio.
How it works. An empty account list means "include everything". The portfolio list screen shows the total number of accounts in your app, and the details view displays all of them organised into their respective portfolio categories.
When you open a portfolio, BudgetViz presents your finances as a hierarchical balance sheet. The view is organised in four levels that you can expand and collapse by tapping.
Net value across all accounts
Tap to expand portfolio categories
e.g. Liquid Assets, Investments
e.g. Savings Account, ISA
Each level shows its total balance, the growth since the start of the reporting period (as both an absolute amount and a percentage), and the proportion it represents of its parent. For example, a portfolio category might show "42.5% of assets".
The balance sheet starts with just the portfolio total and the Assets/Liabilities headers visible. Tap a section header to reveal its portfolio categories, and tap a portfolio category to reveal the individual accounts underneath. This keeps the view clean while letting you drill down when you need detail.
BudgetViz automatically assigns each account to a portfolio category based on its account type. You don't need to configure anything — the mapping is built in. Portfolio categories with a zero balance are hidden to keep the view tidy.
Transaction accounts, savings accounts, cash wallets, and prepaid cards — money you can access quickly.
Investment accounts, retirement funds, and cryptocurrency holdings.
Property and tangible assets like real estate or vehicles.
Money owed to you — small incoming loans and positive-balance split loans.
Accounts of type "Other" that have a positive balance.
Credit card accounts — short-term revolving debt.
Loan accounts, outgoing small loans, and negative-balance split loans.
Accounts of type "Other" that have a negative balance.
Balance-dependent mapping. Some account types (like "Other" and split loans) can appear under assets or liabilities depending on whether their current balance is positive or negative. As the balance changes, the account may shift between categories.
Every portfolio generates a set of reports and charts that help you understand how your finances are evolving. These are the same powerful reports available for budgets, tailored to the portfolio context.
A line chart showing the daily running balance across the entire portfolio for the current reporting period. This is a cumulative view — it includes all historical transactions and opening balances, giving you your true portfolio value at each point in time.
Shows the net change in portfolio value for the current period — how much you gained or lost. This helps you see the momentum of your finances at a glance.
A bar chart showing your portfolio's closing balance for each of the most recent reporting periods, including the current one. This gives you a quick visual sense of how your overall position has been trending over time.
A bar chart showing the net change in portfolio value for each individual day within the current reporting period. Each bar can be positive or negative, making it easy to spot which days drove gains or losses without the cumulative effect masking the detail.
Throughout the balance sheet, each level (section header, portfolio category, and individual account) displays growth information when data is available. Growth is shown as the absolute change in value since the start of the reporting period, along with a percentage. Positive growth appears in green, while negative changes appear in red.
If your portfolio contains accounts in different currencies, all balances are automatically converted to your chosen reporting currency. This gives you a unified view regardless of how many currencies your accounts use. If you haven't set a reporting currency, BudgetViz uses your default currency.
Focus mode lets you temporarily filter the portfolio's reports and charts to focus on a specific subset of your accounts. This is useful when you want to isolate, for example, just your investments or just your liabilities.
Long-press on any section header (Assets or Liabilities) or any portfolio category (like Liquid Assets or Loans & Debt) in the balance sheet. BudgetViz enters focus mode with an action bar at the top of the screen showing what you're filtering by.
Section or portfolio category
Reports filtered
Back to full view
While in focus mode, all charts and reports reflect only the accounts in the selected section or portfolio category. The portfolio balance at the top also updates to show the filtered total. Dismiss the action bar to return to the full portfolio view.
Tap vs. long-press. A regular tap on a section or portfolio category expands/collapses it in the balance sheet. A long-press activates focus mode filtering. Tapping an individual account opens its account details.
The portfolio list screen gives you full control over your portfolios. Here's what you can do.
Swipe right on a portfolio to change its name, accounts, currency, period, or balance target.
Swipe left to remove a portfolio. A confirmation dialog keeps you safe from accidents.
Use the reorder option in the toolbar to drag portfolios into your preferred order.
Long-press a portfolio to add it to your dashboard for quick access.
When viewing a portfolio's details, tap the + button to open the portfolio actions menu. From here you can edit the portfolio settings or add it to your dashboard.
Tap the info icon in the toolbar when viewing a portfolio to see a summary of all available gestures — including how tap, long-press, and swipe work on each level of the balance sheet.
arrow_upward Back to top